


Racing Fundamentals 2: Comprehensive Guide to Grip
A deeper dive into grip from the previous racing fundamentals

MotorsportsNow Driver’s Academy: Racing Fundamentals #2 – Comprehensive Guide to Grip
As per our agreement of going deeper into topics presented in the first fundamentals lesson, we will be exploring key parts of grip, such as what grip is, what affects it, the feeling of breaking grip, and more. It plays an essential role, being one of the fundamentals of what a race car can do.
1. What is Grip?
At the surface level, grip is the result of the friction between the tires and the surface. Grip is defined as a coefficient of friction between both surfaces of the tire and the racing surface, whether that be a racetrack, gravel, or dirt. In mechanics, traction, or grip, is a force that generates motion between a tire and the surface that it drives on, creating a tractive effort, or the pulling or pushing capacity. Tractive effort considers the friction coefficient and weight of the vehicle.
Since weight is just mass acceleration of gravity, we can rewrite this as:
Where F is the traction effort, µ is the friction coefficient, m is the mass on the wheels, and ag is the acceleration due to gravity (9.81 m/s^2). Calculating the friction coefficient can be tricky, as one needs to consider the tire compound and the surface of the track, but is usually given by the manufacturer who have thoroughly experimented and predicted the results. However, these equations only determine the tractive force at the tire and did not consider the engine, transmission, and the drive of the vehicle. Here’s the overall equation with these factors considered:
F = tractive force, Mtorque = engine torque (Nm), 𝜂 = power train efficiency, Tg = Current transmission gear ratio, Dr = driving axle ratio, Df = final drive ratio, Wc = Wheel circumference defined as 2𝜋r in meters. The 2π on top is a hint that we’re working with a full circle, as the radian of a full circle is 2π. The reason why this is brought up is due to the fact that the engine, particularly, engine braking, and the gears play a crucial role in what grip levels the tires are at.
2. What Affects Grip?
Now that we know what grip is, what are the things that affect it? There are three major categories that affect the grip of a tire, which are: factors that determine the coefficient of friction (CoF), size of the contact patch, and the vertical load on the tire.
2 a. CoF of the Tire and Track:
Tire Compound: The compound of the tire and what it’s designed to do is an important factor that all racers and their teams consider before and during the race. The softer the tire, the more deformation the tire experiences, and therefore, more grip since the tire is able to deform into the surface more. However, more deformation means more degradation, meaning the tire will have a shorter life and will need to be changed sooner. This can also be adjusted with tire pressures, though the gains are minimal.
Type of Track Surface: In most motorsports series where they race on pavement, the surface can be drastically changed. Certain kinds of asphalt or pavement may give you different grip levels. If the surface is resurfaced, it can be a mixed bag of either more grip or less grip depending on the state of the track prior to the resurfacing. There will mostly likely be less grip after resurfacing as no rubber is being laid into the track from previous races.
Previous Races: Previous racing events will always leave behind rubber on the track from the degradation that they experience. If a high performant series such as hypercars or formula 1 were previously racing at a track, you will have better grip levels since rubber on rubber creates more friction. If other series previously raced, you’ll still have much higher grip levels, just not as much as if the higher performant tires were previously on the track.
Weather and Temperature: Weather affects the grip drastically disregarding the temperature. A clear sky will allow the heat of the sun to stay consistent and get the most out of a set of tires. A cloudy day will cool down the surface of the track. Winds may carry the heat away from the track and tire surface. Rain will cool the tires and surface of the track and may require a switch to a different tire for the water on the track. Temperature dictates how hot and cold the track and tires get, and therefore the heat transfer is affected. Colder temperatures mean the tire is going to have a lower average temperature causing the tire to not deform as much. A hotter temperature results in higher average temperatures, which can overheat the tires, causing them to lose grip.
2 b. The Size of Contact
The contact patch is the portion of a tire that is making contact with the surface of the track. The bigger the contact patch is, the more grip that is available. The patch moves each corner a driver makes, but tends to skew away from the turn toward the outer wall of the tire. The only way to increase the patch is with wider tires or with switching to a tire with a bigger radius.
2 c. Vertical Load:
The vertical loads a car experiences can increase grip, such as the diving and squatting previously discussed in the last fundamentals course. A car will dive under heavy braking, making the nose of the car push closer to the ground, which increases the grip on the front tires. Squatting happens while accelerating, pushing the back tires down and allowing them more grip. The aerodynamics of the car can affect this, such as formula 1 cars having massive aero elements which increases the vertical load pressing the tires down. Weight transfer plays a role as well, as the weight and the inertia experienced will affect the load on the tires where in a corner, the outside and inside tires will have different grip levels.
3. Breaking Traction:
Breaking traction is the result of pushing the tires past their physical limit. However, this limit isn’t a onetime event, but a gradual event. A driver will be able to tell when the tire is near its limit before actually losing grip. It won’t just fall off the cliff, so there is time to correct and feel the tires approaching their limits before they physically get there. Grip levels can be graphed over a distance for both braking or acceleration and turning.

The graph above shows the brake pressure applied with the steering angle, both being a continuous function, that measures the grip levels on the y-axis and the distance from the initial braking point as the x-axis. There is a grip limit band that is atop the graph to describe the grip as a range instead of a point in time. The braking and steering angle functions go into this band for a limited time, meaning that the brake pressure and steering angle ideally spend time within the band of grip. Within this limit band is where the car will lose some grip and is sliding, but it is still under control.

This graph shows the relationship of steering angle and the throttle application. The axes are still the same, and the steering angle is still present, but throttle application comes after opening the steering wheel, or reducing the steering angle. The distance starting point is from the apex, where maximum steering angle is applied. The steering and throttle both go into the limit band. The band can be described as two functions, f(x) = x + Lmax and g(x) = x + Lmin. The maximum and minimum values of the grip limit can form an area in which the grip limit lies:
The AL is the area of the grip limit, which is equal to the area between Lmax and Lmin. The expression x + Lmax is our f(x) while x + Lmin is our g(x) where f(x) ≥ g(x). For these graphs, it essentially means we are going to sum up the lower and upper bounds of our grip limit with each infinitesimal value of our distances. In this case, our x values are negligible since distance doesn’t dictate what the lower and upper bounds of the limit are. We can simply express the area between these two functions as AL= Lmax – Lmin or in plain terms, we are describing how big the area is with respect to the lower and upper bounds of our grip limit, where Lmax is the maximum limit while Lmin is the minimum limit. This describes two types of traction loss, which is the longitudinal forces we’ve described above, which is the acceleration and braking. This is when the tires are spinning or micro-locking. The other happens laterally, where the tire experiences understeer and oversteer.
4. Approaching Maximum Grip:
This section is going to be more abstract since the techniques, track and car knowledge, and experience required help one find the maximum grip levels, but a general idea of approaching the limit is important. Approaching these limits requires practice with a certain track and car combination and a step-by-step approach. The key area is at maximum rotation where the car reaches minimum speeds during a corner. Generally, you want to take incremental steps on the minimum speed, such as adding 5 kph to the minimum speed for one particular corner at the apex each lap completed. This may require playing with the braking point and the braking zone, where within the braking zone, the driver is threshold braking. The point of this is to find the optimal minimum speed on the optimal racing line by building up the optimal minimum speed incrementally for each consecutive lap.
An important note for beginners; do not make sudden inputs or react harshly when trying to correct the under or oversteer. This is typical for newcomers, where a moment of understeer or oversteer occurs while trying to approach the maximum grip, however, these jerky corrections can turn a small slide into a nasty crash. The harsh inputs unsettle the car in a lot of ways, so keep the wheel and pedal inputs smooth and minimal. Another thing we typically see is slow reaction time to when the car is losing grip, but that comes with time and experience. Sometimes it is a good thing to have a moment because you can learn from it, but there are ways to keep the damage minimal or nonexistent. The jerky and slow inputs can be thought of as catching a falling person and getting them back on their feet. If you catch the person late, then it’ll be much harder to get them back on their feet, and if you decided to abruptly shove them, they will just fall the other way. Whereas if you caught them early, it’ll be easier to lift them back up, and gradually getting them back on their feet won’t make them fall the other way.
5. Lateral and Longitudinal Forces:
Up until this section, finding the grip and its limits seems like a bunch of guess work. There’s instrumentation and accelerometers within these cars during practices, qualifying, and racing that tells the team and the driver if the driver had gotten close to the limit. These devices use the data to make a graph that helps visualize what grip was reached and at what corner. One of these graphs is called a traction circle. The traction circle plots grip levels as either a percentage or accelerative forces, such as g’s, within a confined circle. The middle of the circle means that no force is experienced, which means the driver is stationary or on a straightaway. The outermost point touching the circumference of the circle means maximum grip has been reached. Touching the bottom means maximum grip for braking is reached, likewise, the top is for maximum accelerative grip. Moving up or down the circle measures longitudinal forces. Going right or left measures lateral forces, where each direction is respective to which direction the car is turning.

Let’s go over how a driver at the absolute limit constantly throughout a turn would look like on these circles:

Here, the driver is braking going into a corner, quickly but smoothly reaching the limit under braking.
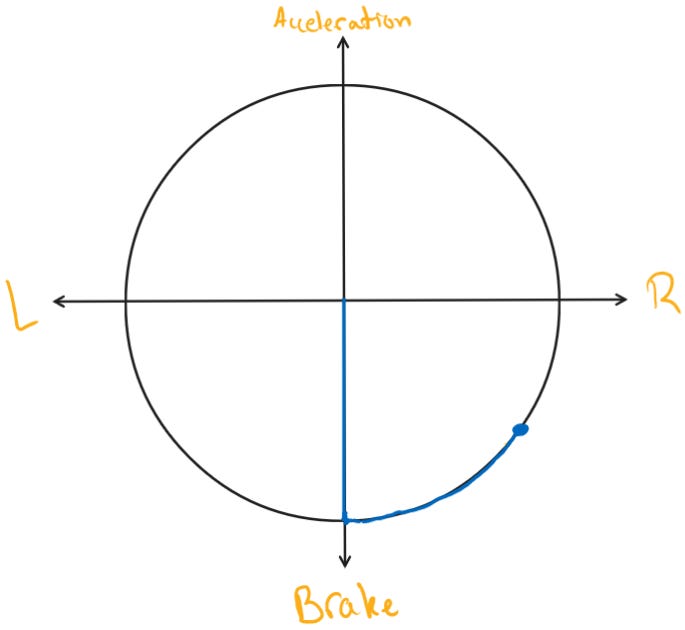
Now the driver is threshold braking and turning at the same time. If he had not gradually gotten off the brakes while turning, the blue dot would be slightly to the right instead of fully to the right, closer to the middle while the dot slowly moves upward as well.

The driver is completely off the brake and is at the apex, fully rotating the car at the desired minimum speed.

The driver has his wheel turned straight and his throttle application is at its maximum. Both inputs were smoothly applied and built up gradually until the car is out of the corner.
The outputs from the devices can be graphed onto a plane where ‘x’ is the time and ‘y’ is the forces experienced. This is typically replaced with a graph that shows speed as the ‘y’ as they provide more information and detail to analyze driver performance.